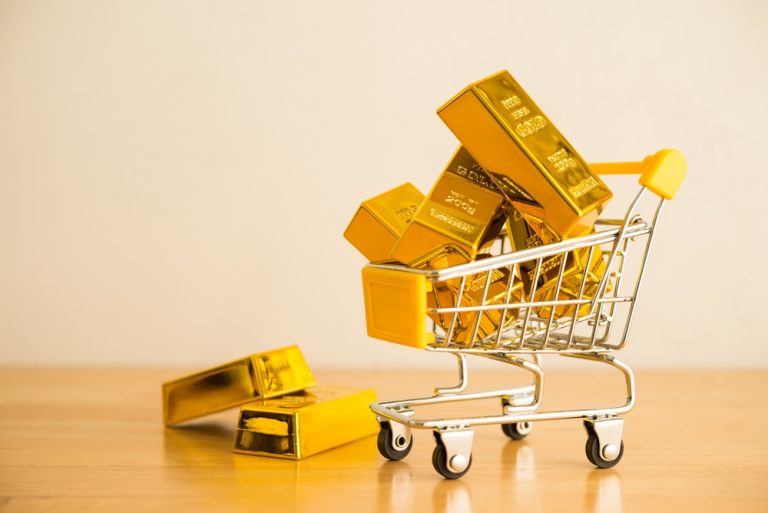


Gold price consolidates as more inflation-influencing US economic data looms on Friday
The World Gold Council sees positive narrative for gold remaining intact this year
Top performing ASX goldies this week led by: SIH, CBY, KTA
This week in gold. The Fed’s JPow spoke. Saw no sign of stag, no sign of ‘flation. The precious yellow metal pulled back a tad. A mere bump in the road? Further golden days ahead, predict analysts.
Let’s look a little closer, using slightly longer sentences here and there…
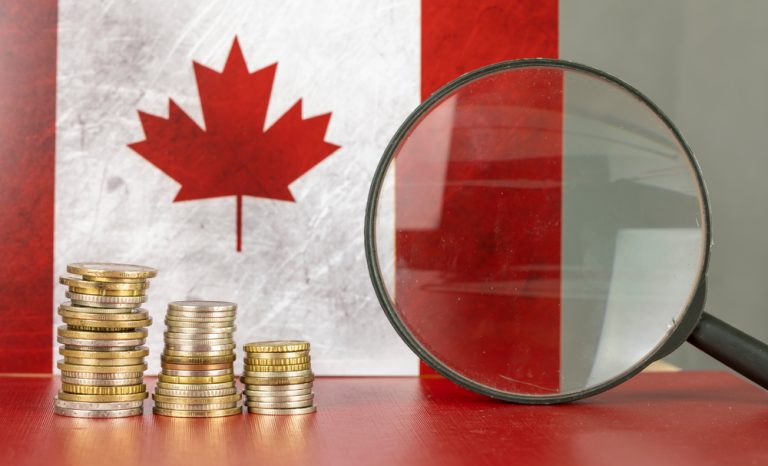
The price of gold in US dollars appears to have stabilised and held its ground at the $2,300 mark. At the time of thinking about the beer fridge late on an Aussie Friday afternoon, it’s changing hands for US$2,307.
In plastic fantastic Aussie dollars, it’s kicking around $3,511, down about $200 from the ATH of a couple of weeks ago, but still in fairly fine fettle.
Here’s a chart…
Source: abcbullion.com.au
What are some regular gold-watching analysts saying about the slight pullback and consolidation? Pretty much what we said further above.
That said, the US Fed’s latest FOMC meeting breakdown and message to the markets this week did muddy the waters just slightly with a bit of a bet each way on inflation and a sweet’n’sour tone.
The next catalyst from the always influential US of A is imminent, and it’s the monthly US (nonfarm) jobs data, which should (well maybe) provide some clarity about the strength of the US economy.
As Bloomberg writes:
“The nonfarm payrolls report may show a slower pace of gains, which could help bolster bets on rate cuts. Lower rates are typically positive for the non-interest bearing metal.”
Gold trajectory still intact?
The Fed’s latest unchanged interest rates non-move initially offered some respite for markets, including gold. The added statement from Powell was less hawkish than perhaps expected, too.
That, however, according to European editor of FXStreet and analyst Joaquin Monfort, saw gold dip on improved market sentiment and lower safe-haven demand.
But gold can ride the coattails of improved market sentiment, too, right? Yep – it’s a complicated old rock sometimes.
“Gold bulls bid up the price after the Fed decided to leave interest rates unchanged and to slow the pace of reduction of its US Treasury holdings, a mildly dovish move as it unwinds quantitative tightening,” added Monfort.
Gold’s inflation-hedge narrative is still one of its strongest, though, and the FXStreet analyst noted the pinch of hawkishness added into the Fedspeak soup that stated “in recent months, there has been a lack of further progress toward the Committee’s 2 percent inflation objective”.
Essentially, though, the message of: no rate cuts in the near term, but no rate hikes likely, either, has markets, including gold, perhaps in a state of limbo for now.
Monfort, though, sees the overall, medium-to-long term upside trajectory as remaining well in play.
The World Gold Council says…
… that global desire for gold remains strong, and in fact, gold demand has just marked its strongest quarter in eight years – up 3% year on year.
That’s been led by “healthy investment” from the OTC (over the counter) market, and “persistent central bank buying” as well as higher demand from Asian buyers.
The World Gold Council, by the way, is a prominent and highly influential global member organisation of gold analysts and experts generally championing the role of gold as a strategic asset.
Aussies are letting the side down, though
In its Gold Demand Trends Q1 2024 report, the WGC also noted, interestingly, that: “Australia was an outlier, recording its lowest quarter on record for gold consumption, though ETF holdings remained relatively stable”.
At 4.3t, Australia’s gold consumption came down 37% from Q1 2023, including a halving in demand for bar and coins and a 15% drop in jewellery consumption over that time.
Cheapskates, us lot so far this year, then.
Shaokai Fan, Head of Asia-Pacific and Global Head of Central Banks at the WGC, commented:
“Australians, like most western investors, proved price sensitive and did not buy into the recent gold rally which saw the A$ price of gold jump 11.9% over the quarter, ending at A$3,397/oz. Continued momentum has since seen gold rise 6.3% in Q2 to A$3597.9/oz2, contributing to a total 2024 YTD rise of 18.2%.
“The decline in demand for gold ETFs was more modest as Australian investors held their gold ETFs relatively steady in Q1. The regional gold ETF holdings reached 40.5t in March, a mild 0.4t loss in the quarter and a 0.8t decline y/y.”
But, overall, things are looking good for rest of 2024
As for global (particularly led by China) central banks, though, as mentioned earlier at least they’re continuing to pick up the slack, adding 290t to official global holdings during the quarter.
“Consistent and substantial purchases by the official sector highlight gold’s importance in international reserve portfolios amidst market volatility and increased risk,” noted the World Gold Council.
Source: World Gold Council Gold Demand Trends Q1 2024
In addition, demand for gold in technology recovered 10% year-on-year driven by the AI boom in the electronics sector.
Louise Street, Senior Markets Analyst at the World Gold Council, said:
“Since March, the gold price has climbed to all-time highs, despite traditional headwinds of a strong US dollar and interest rates that are proving to be ‘higher for longer’.
“Typically, investors in Eastern markets are more responsive to the price, waiting for a dip to buy, whereas Western investors have historically been attracted to a rising price, tending to buy into the rally.
“In Q1, we saw those roles reversed with investment demand in markets such as China and India growing considerably as the gold price surged,” continued Street, before adding:
“Looking ahead, 2024 is likely to produce a much stronger return for gold than we anticipated at the beginning of the year, based on its recent performance.
“Should the price level off in the coming months, some price-sensitive buyers may re-enter the market and investors will continue to look to gold for a safe haven asset as they seek clarity around rate cuts and election results.”
ASX Winners & Losers
Here’s how ASX-listed precious metals stocks are performing, circa 4pm May 3:
Scroll or swipe to reveal table. Click headings to sort. Best viewed on a laptop.
Stocks missing from this list? Please email [email protected]
Code Company Price % Week % Month % Year Market Cap MRR Minrex Resources Ltd 0.011 -8% -15% -31% $13,018,410 NPM Newpeak Metals 0.021 5% 91% -79% $2,613,223 ASO Aston Minerals Ltd 0.012 -8% 0% -88% $14,245,707 MTC Metalstech Ltd 0.23 31% 35% -38% $40,625,237 FFX Firefinch Ltd 0.2 0% 0% 0% $236,569,315 GED Golden Deeps 0.038 3% -22% -46% $4,620,894 G88 Golden Mile Res Ltd 0.011 -8% -8% -45% $5,345,897 DCX Discovex Res Ltd 0.002 0% 0% -33% $6,605,136 NMR Native Mineral Res 0.017 -32% -19% -43% $4,197,010 AQX Alice Queen Ltd 0.005 0% 0% -71% $3,454,950 SLZ Sultan Resources Ltd 0.012 9% 0% -69% $2,371,038 MKG Mako Gold 0.014 -7% 8% -56% $13,664,115 KSN Kingston Resources 0.069 -3% -17% -27% $42,457,516 AMI Aurelia Metals Ltd 0.195 3% 22% 51% $337,953,481 PNX PNX Metals Limited 0.005 -17% 25% 67% $29,851,074 GIB Gibb River Diamonds 0.031 41% 11% -31% $6,556,793 KCN Kingsgate Consolid. 1.55 -4% 18% 14% $400,803,881 TMX Terrain Minerals 0.0035 -30% -13% -42% $5,726,683 BNR Bulletin Res Ltd 0.053 15% -16% -35% $14,387,053 NXM Nexus Minerals Ltd 0.067 3% 34% -24% $26,067,029 SKY SKY Metals Ltd 0.034 -3% 6% -29% $19,308,631 LM8 Lunnonmetalslimited 0.29 4% 16% -73% $63,174,577 CST Castile Resources 0.09 -4% 25% -7% $21,771,218 YRL Yandal Resources 0.115 -26% 19% 46% $32,136,914 FAU First Au Ltd 0.002 0% 0% -43% $3,323,987 ARL Ardea Resources Ltd 0.645 -24% -5% 47% $130,713,709 GWR GWR Group Ltd 0.1 -13% -5% 27% $35,333,832 IVR Investigator Res Ltd 0.047 -11% 9% -16% $72,858,460 GTR Gti Energy Ltd 0.006 -8% -20% -33% $12,299,683 IPT Impact Minerals 0.022 10% 47% 69% $57,294,078 BNZ Benzmining 0.15 -6% 15% -58% $16,691,696 MOH Moho Resources 0.004 -20% -20% -78% $2,156,713 BCM Brazilian Critical 0.022 -12% -4% -68% $17,758,964 PUA Peak Minerals Ltd 0.003 0% -14% -25% $3,124,130 MRZ Mont Royal Resources 0.052 -9% -26% -44% $4,336,519 SMS Starmineralslimited 0.036 -3% 0% -49% $2,809,144 MVL Marvel Gold Limited 0.009 0% 0% -31% $7,774,116 PRX Prodigy Gold NL 0.002 -33% -33% -80% $5,034,435 AAU Antilles Gold Ltd 0.012 -33% -37% -65% $13,181,490 CWX Carawine Resources 0.1 -5% -7% 6% $23,612,545 RND Rand Mining Ltd 1.57 -1% 12% 14% $89,295,259 CAZ Cazaly Resources 0.018 6% -5% -33% $8,183,454 BMR Ballymore Resources 0.125 -4% -4% -22% $22,091,323 DRE Dreadnought Resources Ltd 0.0155 -3% -14% -74% $59,722,240 ZNC Zenith Minerals Ltd 0.082 -14% -12% -47% $28,895,232 REZ Resourc & En Grp Ltd 0.013 0% 30% -19% $6,497,475 LEX Lefroy Exploration 0.11 -8% 10% -59% $22,050,433 ERM Emmerson Resources 0.045 0% -6% -38% $25,056,650 AM7 Arcadia Minerals 0.073 0% -14% -64% $7,960,657 ADT Adriatic Metals 4.5 7% 13% 29% $1,195,241,524 AS1 Asara Resources Ltd 0.01 -9% 11% -69% $8,821,754 CYL Catalyst Metals 0.88 1% 21% -9% $197,186,214 CHN Chalice Mining Ltd 1.12 -3% 1% -86% $433,694,084 KAL Kalgoorliegoldmining 0.031 -9% 24% -21% $5,389,024 MLS Metals Australia 0.022 0% 0% -37% $14,147,390 ADN Andromeda Metals Ltd 0.018 -5% -10% -54% $55,984,877 MEI Meteoric Resources 0.2175 -1% -7% 40% $447,776,965 SRN Surefire Rescs NL 0.01 11% 11% -44% $19,863,078 SIH Sihayo Gold Limited 0.0025 150% 150% 25% $30,510,640 WA8 Warriedarresourltd 0.0515 12% 23% -63% $29,992,937 HMX Hammer Metals Ltd 0.043 -7% 2% -48% $38,115,516 WCN White Cliff Min Ltd 0.016 14% 7% 100% $24,365,811 AVM Advance Metals Ltd 0.026 4% -32% -81% $1,185,540 WRM White Rock Min Ltd 0 -100% -100% -100% $17,508,200 ASR Asra Minerals Ltd 0.007 0% 17% -30% $11,647,970 MCT Metalicity Limited 0.002 0% 0% -20% $8,970,108 AME Alto Metals Limited 0.037 -14% 12% -46% $26,696,357 CTO Citigold Corp Ltd 0.005 0% 25% -17% $16,500,000 TIE Tietto Minerals 0.675 0% 11% 15% $774,717,507 SMI Santana Minerals Ltd 1.1375 -10% -14% 61% $204,554,935 M2R Miramar 0.01 0% -44% -77% $1,674,782 MHC Manhattan Corp Ltd 0.002 0% -33% -56% $5,873,960 GRL Godolphin Resources 0.025 -14% -31% -67% $4,662,478 SVG Savannah Goldfields 0.035 25% 40% -79% $7,870,378 EMC Everest Metals Corp 0.094 1% 12% 27% $15,278,329 GUL Gullewa Limited 0.055 0% 0% 0% $11,262,521 CY5 Cygnus Metals Ltd 0.083 -11% 60% -67% $23,907,849 G50 Gold50Limited 0.155 -11% 7% 0% $17,486,400 ADV Ardiden Ltd 0.155 0% -3% -49% $10,002,801 AAR Astral Resources NL 0.063 -11% 0% -16% $58,785,145 VMC Venus Metals Cor Ltd 0.083 -11% -11% -29% $15,747,481 NAE New Age Exploration 0.004 0% -11% -27% $7,175,596 VKA Viking Mines Ltd 0.011 0% 22% 10% $11,277,843 LCL LCL Resources Ltd 0.012 0% 9% -61% $11,462,706 ADG Adelong Gold Limited 0.004 0% 0% -64% $2,911,467 RMX Red Mount Min Ltd 0.001 0% -24% -62% $2,673,576 PRS Prospech Limited 0.044 13% 13% 57% $11,886,544 TTM Titan Minerals 0.028 -3% -3% -53% $52,471,063 NML Navarre Minerals Ltd 0.019 0% 0% -32% $28,555,654 MZZ Matador Mining Ltd 0.07 -11% 30% -5% $36,201,615 KZR Kalamazoo Resources 0.088 -3% 0% -35% $15,382,711 BCN Beacon Minerals 0.029 0% 12% -9% $108,946,277 MAU Magnetic Resources 1.05 -1% 11% 112% $264,450,608 BC8 Black Cat Syndicate 0.26 -4% 8% -42% $81,766,663 EM2 Eagle Mountain 0.075 27% 34% -34% $30,644,244 EMR Emerald Res NL 3.355 -2% 10% 75% $2,118,336,010 BYH Bryah Resources Ltd 0.008 0% -20% -65% $3,483,628 HCH Hot Chili Ltd 1.25 4% 5% 26% $149,306,508 WAF West African Res Ltd 1.3875 7% 9% 48% $1,377,171,439 MEU Marmota Limited 0.043 8% -4% 23% $45,528,425 NVA Nova Minerals Ltd 0.28 -5% 12% -21% $57,502,858 SVL Silver Mines Limited 0.1625 -10% -10% -24% $248,825,982 PGD Peregrine Gold 0.225 2% 0% -39% $15,612,037 ICL Iceni Gold 0.027 4% 23% -56% $7,150,271 FG1 Flynngold 0.034 -17% -22% -44% $5,580,791 WWI West Wits Mining Ltd 0.014 -13% -7% 0% $38,886,266 RML Resolution Minerals 0.0025 -17% 0% -50% $3,220,044 AAJ Aruma Resources Ltd 0.016 0% -16% -77% $2,953,373 AL8 Alderan Resource Ltd 0.005 0% 0% -29% $5,534,307 GMN Gold Mountain Ltd 0.004 0% -20% 33% $10,414,270 MEG Megado Minerals Ltd 0.01 0% -9% -75% $2,544,556 HMG Hamelingoldlimited 0.076 3% 6% -31% $11,812,500 TBA Tombola Gold Ltd 0.026 0% 0% 0% $33,129,243 BM8 Battery Age Minerals 0.1025 6% 3% -72% $9,405,433 TBR Tribune Res Ltd 4.48 2% 13% 28% $233,482,943 FML Focus Minerals Ltd 0.13 -35% -30% -35% $38,685,417 GSR Greenstone Resources 0.01 11% 43% -44% $11,672,687 VRC Volt Resources Ltd 0.005 -17% -17% -55% $20,793,391 ARV Artemis Resources 0.0165 3% -3% 27% $28,750,335 HRN Horizon Gold Ltd 0.27 0% 4% -22% $37,658,380 CLA Celsius Resource Ltd 0.011 10% -15% -39% $26,707,040 QML Qmines Limited 0.066 6% -6% -56% $15,172,011 RDN Raiden Resources Ltd 0.036 -3% 44% 929% $90,323,894 TCG Turaco Gold Limited 0.2 18% 11% 239% $120,761,889 KCC Kincora Copper 0.036 -8% -16% -45% $7,993,810 GBZ GBM Rsources Ltd 0.01 -9% -9% -70% $11,566,889 DTM Dart Mining NL 0.026 -16% -19% -58% $6,977,688 MKR Manuka Resources. 0.067 -18% -9% -14% $47,039,968 AUC Ausgold Limited 0.028 -7% -20% -43% $59,699,671 ANX Anax Metals Ltd 0.027 13% 8% -60% $15,965,562 EMUDA EMU NL 0.026 73% -13% -65% $1,349,848 SFM Santa Fe Minerals 0.049 4% 9% -11% $3,568,121 SSR SSR Mining Inc. 8.08 0% 13% -62% $38,327,950 PNR Pantoro Limited 0.083 -3% 19% 15% $442,342,594 CMM Capricorn Metals 4.79 -3% -10% 10% $1,834,300,231 X64 Ten Sixty Four Ltd 0.57 0% 0% 0% $130,184,182 SI6 SI6 Metals Limited 0.003 0% 0% -40% $7,106,578 HAW Hawthorn Resources 0.075 9% 7% -6% $25,126,171 BGD Bartongoldholdings 0.28 -2% 6% 12% $61,167,960 SVY Stavely Minerals Ltd 0.026 -13% -16% -81% $10,312,383 AGC AGC Ltd 0.099 25% 27% 98% $20,666,667 RGL Riversgold 0.0065 8% -7% -64% $6,289,799 TSO Tesoro Gold Ltd 0.038 3% 46% -12% $47,953,648 GUE Global Uranium 0.11 17% 10% -12% $28,986,465 CPM Coopermetalslimited 0.12 -4% 4% -66% $9,402,678 MM8 Medallion Metals. 0.056 -8% -8% -43% $17,228,493 FFM Firefly Metals Ltd 0.7775 9% 2% 30% $346,785,154 CBY Canterbury Resources 0.055 96% 49% 57% $10,304,454 LYN Lycaonresources 0.4 43% 158% 167% $14,979,125 SFR Sandfire Resources 9.42 3% 6% 49% $4,250,029,357 TMZ Thomson Res Ltd 0.005 0% 0% 0% $4,881,018 TAM Tanami Gold NL 0.038 0% -5% -5% $45,828,785 WMC Wiluna Mining Corp 0 -100% -100% -100% $74,238,031 NWM Norwest Minerals 0.045 -4% 55% 32% $15,136,661 ALK Alkane Resources Ltd 0.58 -11% -11% -32% $353,010,830 BMO Bastion Minerals 0.006 -14% -33% -77% $2,583,503 IDA Indiana Resources 0.081 -2% 7% 88% $49,776,708 GSM Golden State Mining 0.011 10% 0% -66% $3,073,077 NSM Northstaw 0.04 0% -11% -59% $5,595,031 GSN Great Southern 0.02 0% -13% -17% $16,349,674 RED Red 5 Limited 0.42 -2% 6% 171% $1,489,434,236 DEG De Grey Mining 1.245 -5% -5% -20% $2,341,850,889 THR Thor Energy PLC 0.017 -15% -26% -66% $3,303,970 CDR Codrus Minerals Ltd 0.042 8% 2% -68% $4,724,344 MDI Middle Island Res 0.017 -11% 6% -58% $3,703,518 WTM Waratah Minerals Ltd 0.115 -18% 34% -4% $17,923,740 POL Polymetals Resources 0.285 0% 8% -11% $44,132,986 RDS Redstone Resources 0.004 14% -20% -64% $3,701,514 NAG Nagambie Resources 0.0125 14% -11% -67% $9,957,946 BGL Bellevue Gold Ltd 1.6925 -2% -13% 27% $2,048,574,821 GBR Greatbould Resources 0.061 0% 2% -31% $36,032,511 KAI Kairos Minerals Ltd 0.012 0% -8% -40% $28,830,034 KAU Kaiser Reef 0.13 -10% -13% -40% $23,090,926 HRZ Horizon 0.034 0% -6% -40% $25,936,396 CAI Calidus Resources 0.1275 -2% 2% -31% $102,780,050 CDT Castle Minerals 0.0055 -8% -8% -68% $7,346,958 RSG Resolute Mining 0.4125 2% -6% -11% $926,136,756 MXR Maximus Resources 0.034 -8% 12% -8% $9,949,319 EVN Evolution Mining Ltd 3.745 -6% -1% 8% $7,844,217,144 CXU Cauldron Energy Ltd 0.039 -7% -3% 559% $48,646,025 DLI Delta Lithium 0.3125 8% 10% -30% $221,156,214 ALY Alchemy Resource Ltd 0.008 33% 14% -43% $8,246,534 HXG Hexagon Energy 0.022 0% -12% 100% $10,258,318 OBM Ora Banda Mining Ltd 0.315 5% 5% 133% $611,987,162 SLR Silver Lake Resource 1.4075 -1% 11% 18% $1,332,010,675 AVW Avira Resources Ltd 0.001 0% 0% -67% $2,133,790 LCY Legacy Iron Ore 0.016 0% 7% 0% $131,130,320 PDI Predictive Disc Ltd 0.2 -5% -11% 8% $404,867,597 MAT Matsa Resources 0.033 3% 10% -6% $14,843,545 ZAG Zuleika Gold Ltd 0.02 0% 5% 25% $14,721,710 GML Gateway Mining 0.016 -11% -30% -65% $5,527,351 SBM St Barbara Limited 0.2425 -8% 28% -8% $212,672,299 SBR Sabre Resources 0.017 6% -11% -26% $7,110,977 STK Strickland Metals 0.1025 -21% 3% 163% $176,940,495 ION Iondrive Limited 0.008 -11% -20% -64% $3,890,282 CEL Challenger Gold Ltd 0.073 -6% -9% -44% $99,476,187 LRL Labyrinth Resources 0.005 -17% -17% -57% $5,937,719 NST Northern Star 14.34 -4% -3% 8% $16,748,029,131 OZM Ozaurum Resources 0.053 -26% 15% -7% $8,413,750 TG1 Techgen Metals Ltd 0.028 -13% 0% -69% $3,587,712 XAM Xanadu Mines Ltd 0.069 -1% 8% 57% $118,404,415 AQI Alicanto Min Ltd 0.024 20% -14% -38% $14,152,747 KTA Krakatoa Resources 0.019 73% 111% -42% $8,025,823 ARN Aldoro Resources 0.068 -3% -6% -50% $9,423,662 WGX Westgold Resources. 2.13 -1% -23% 37% $1,041,970,006 MBK Metal Bank Ltd 0.021 5% -5% -29% $8,199,645 A8G Australasian Metals 0.085 23% 42% -43% $4,273,881 TAR Taruga Minerals 0.008 0% 33% -47% $5,648,214 DTR Dateline Resources 0.011 -8% -21% -35% $15,980,636 GOR Gold Road Res Ltd 1.605 -3% -3% -12% $1,744,184,746 S2R S2 Resources 0.125 4% -7% -11% $54,342,959 NES Nelson Resources. 0.003 0% 0% -40% $1,840,783 TLM Talisman Mining 0.275 6% 2% 72% $51,788,096 BEZ Besragoldinc 0.105 19% 19% -48% $41,391,990 PRU Perseus Mining Ltd 2.23 1% 2% 4% $3,063,554,409 SPQ Superior Resources 0.01 -9% -9% -72% $20,012,204 PUR Pursuit Minerals 0.0045 -10% 13% -74% $14,719,857 RMS Ramelius Resources 1.9225 -5% 6% 50% $2,239,552,103 PKO Peako Limited 0.005 25% 25% -38% $2,635,424 ICG Inca Minerals Ltd 0.005 11% -17% -76% $4,023,694 A1G African Gold Ltd. 0.024 -28% -20% -62% $4,915,180 OAU Ora Gold Limited 0.005 0% -17% 67% $29,030,004 GNM Great Northern 0.01 -23% -23% -67% $1,546,291 KRM Kingsrose Mining Ltd 0.035 -3% 0% -45% $26,338,428 BTR Brightstar Resources 0.016 -11% -11% 0% $46,497,490 RRL Regis Resources 2.045 -7% 1% -2% $1,578,658,109 M24 Mamba Exploration 0.022 5% -12% -78% $4,049,810 TRM Truscott Mining Corp 0.07 0% 35% 75% $12,135,694 TNC True North Copper 0.084 -2% -14% 58% $33,657,388 MOM Moab Minerals Ltd 0.005 0% -17% -44% $3,559,815 KNB Koonenberrygold 0.015 -21% -17% -60% $4,029,025 AWJ Auric Mining 0.17 -6% -15% 227% $25,254,073 AZS Azure Minerals 3.69 11% 1% 858% $1,692,527,632 ENR Encounter Resources 0.39 11% 50% 111% $175,491,441 SNG Siren Gold 0.06 0% 7% -40% $12,468,598 STN Saturn Metals 0.24 -2% 26% 45% $53,760,594 USL Unico Silver Limited 0.145 -9% 7% 7% $44,857,739 PNM Pacific Nickel Mines 0.032 -6% 23% -62% $13,384,099 AYM Australia United Min 0.003 0% -25% 0% $5,527,732 ANL Amani Gold Ltd 0.001 0% 0% 0% $25,143,441 HAV Havilah Resources 0.215 13% 26% -12% $68,077,430 SPR Spartan Resources 0.57 -7% -14% 350% $623,982,595 PNT Panthermetalsltd 0.039 8% 30% -44% $3,399,480 MEK Meeka Metals Limited 0.033 -3% -6% -15% $40,745,395 GMD Genesis Minerals 1.6975 -4% -12% 27% $1,907,286,671 PGO Pacgold 0.155 -6% -3% -62% $13,463,270 FEG Far East Gold 0.13 8% -19% -54% $34,774,223 MI6 Minerals260Limited 0.145 -9% -6% -64% $34,515,000 IGO IGO Limited 7.96 9% 12% -41% $5,891,543,585 GAL Galileo Mining Ltd 0.275 6% 4% -65% $53,358,730 RXL Rox Resources 0.17 -24% -10% -54% $64,636,996 KIN KIN Min NL 0.066 -4% 0% 69% $78,936,087 CLZ Classic Min Ltd 0.0075 7% -42% -85% $2,170,241 TGM Theta Gold Mines Ltd 0.15 -6% -14% 111% $106,730,976 FAL Falconmetalsltd 0.13 -7% -4% -63% $23,895,000 SXG Southern Cross Gold 2.26 10% 23% 327% $213,267,445 SPD Southernpalladium 0.5 0% 52% 1% $22,400,730 ORN Orion Minerals Ltd 0.018 0% 29% 13% $111,079,409 TMB Tambourahmetals 0.07 -11% -7% -44% $5,474,063 TMS Tennant Minerals Ltd 0.023 -4% -15% -32% $21,029,589 AZY Antipa Minerals Ltd 0.011 0% -8% -42% $45,482,887 PXX Polarx Limited 0.013 0% 8% 3% $26,643,769 TRE Toubani Res Ltd 0.12 -11% -14% -23% $20,079,850 AUN Aurumin 0.038 -22% 6% 27% $18,109,211 GPR Geopacific Resources 0.022 -19% 16% -8% $18,899,500 FXG Felix Gold Limited 0.07 -4% 71% -26% $16,369,994 ILT Iltani Resources Lim 0.19 9% 27% 0% $6,461,996 KGD Kula Gold 0.01 -9% 43% -16% $4,620,000 ARD Argent Minerals 0.016 -16% 33% 33% $19,418,052
Notable weekly gainers
Sihayo Gold (ASX:SIH) +150%
Canterbury Resources (ASX:CBY) +96%
Krakatoa Resources (ASX:KTA) +73%
Emu (ASX:EMU) +73%
Lycaon Resources (ASX:LYN) +43%
The post Gold Digger: Precious metal steady amid Fed’s muddy yellow waters appeared first on Stockhead.