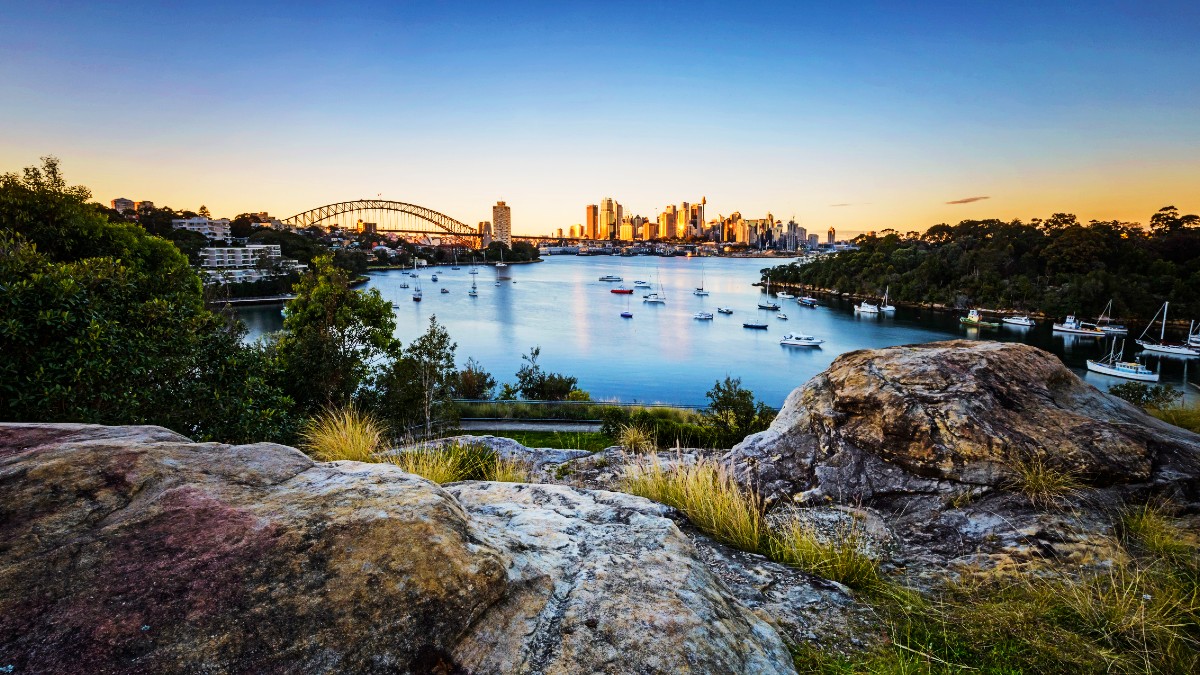
“Dwell I but in the suburbs of your good pleasure?”
Friends of the show will recall that at the beginning of this, the 11th month in the year of our enormous headache, Australia’s property prices once again clocked into record levels across several capital cities.
Not a lot of supply and a torrent of demand, spurred on by a fast rising population has easily offset the pinch of higher interest rates.
Last month, according to data analysed by PropTrack, home prices in some parts of Brisbane, Adelaide, and Perth recorded annual gains of more than +15%, while prices in Sydney were+ 7.5% higher than a year ago.
Now, according to property data firm CoreLogic, exactly 82.4% of the 4,506 Aussie suburbs they’ve gone and analysed saw home values rise across the three months to October.
However, while many parts of Sydney, Perth, Adelaide and Brisbane are all at record peaks, there is another end of the stick which much of Australia is fortunate enough not to be whacked with – according to the new research there’s some 792 (or 17.6%) suburbs where values have fallen over the past three months.
A patchwork housing economy
CoreLogic’s head of research Eliza Owen says our capital city markets are running at very different speeds, with Perth the strongest market while Hobart and Darwin are flat or falling.
“Australia’s housing market upswing has become more widespread, with four in five house and unit markets analysed nationally recording a rise in values over the past three months.”
Updated with data to the end of October 2023, CoreLogic’s latest Mapping the Market Report (which is interactive, btw) found 83.1% of national house markets and 80.6% of unit markets saw values rise in the past three months.
Eliza says this broadly reflects continued growth in the Australian housing market, despite high interest rates and weakening economic conditions.
“It’s often noted that Australia is not ‘one housing market’ and we’re currently seeing increased diversity in capital city market performance,” Ms Owen, the Duchess of Data, says.
“That’s reflected in city-wide growth rates, the various levels of supply that’s available in some cities over others, and it’s reflected in the different suburbs we analyse in this report.
“At one end of the spectrum, suburb-level analysis reflects the extraordinary growth trend across cities like Adelaide, Perth and Brisbane. In these cities, total listings levels are low, city-wide capital growth is running a bit over 1% per month, and migration trends from both overseas and interstate favour more housing demand.”
Across regional markets, conditions are equally diverse, with Regional Queensland the strongest house market and Regional SA the best performing unit market.
Portion of suburbs recording quarterly and annual falls in values
Capitals where prices are flat or already falling
In both Hobart and Darwin, 41% of house markets saw a quarterly decline, Eliza says.
“So, overall, Hobart home values ticked 0.3% higher in the past three months, but capital growth trends have been shaky, and total listings are trending around 47% higher than the previous five-year average.
“The city has seen value falls recorded in three of the past six months. Declines across Hobart houses were led by a -3.2% fall across the relatively expensive market of Sandford,” Eliza says, apparently expecting us mainlanders to know what she’s talking about.
“Canberra has also seen relatively flat capital growth trends, and particular weakness in the unit market. 32 of 39 unit markets analysed in Canberra saw a quarterly decline, with the steepest fall in O’Connor, down -4.1%.”
Likewise.
Capital cities running at mid-speed
Eliza has the country’s greatest city, Sydney, and its most disappointing, Melbourne, right in the fair-to-middling bracket right now.
The country’s two largest housing markets are running at ‘mid-speed’, where city-wide capital growth was 2.5% and 1.2% respectively in the past three months.
“The pace of growth across both markets has slowed from the middle of the year, when the June rate-hike surprised financial markets and many economists’ predictions.
“Currently, growth in Sydney markets are strongest across relatively expensive house markets, with Five Dock houses topping the three-month capital growth ranking (up 8.4%). In Melbourne, it was the more mid-priced unit market of Moorabbin which topped the list, increasing 7.4%.”
Capital cities running at high speed
In Brisbane, each of the 162 unit markets analysed saw values rise in the past three months, while of the 305 house markets, only four saw a quarterly decline.
These were the higher-end suburbs of Kalinga and Windsor as well as the more affordable Redland spots of Macleay Island and Lamb Island.
In Adelaide, only 3% of house markets saw a decline in the quarter, but there was a notable portion of unit markets in decline (13.4%, or 9 of the 67 suburbs analysed).
In Perth, there was one suburb where house values fell in the past three months, which was Mount Hawthorn, and Ms Owen said even there the house market sustained only a mild decline of -0.2%.
“Remarkably, 98.1% of the house and unit markets across Perth rose in value over the past three months, and 96.3% of suburb dwelling markets in Perth were at record high values at the end of October.”
The post These are the suburbs where the Aussie property dream is still rising appeared first on Stockhead.


+ There are no comments
Add yours